
Reporting Dashboards That Turn Scattered Numbers Into Clear Decisions
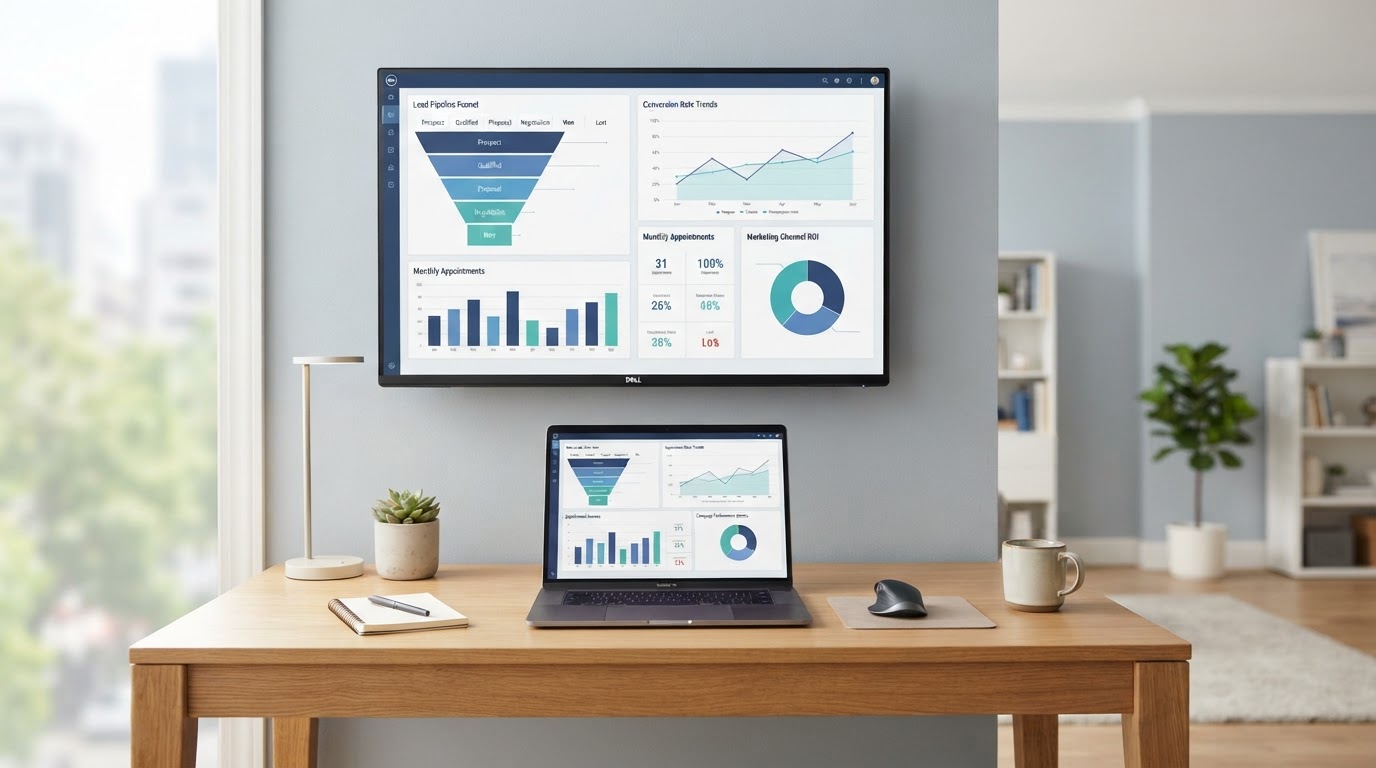
A practical dashboard pulls together the lead, pipeline, appointment, marketing, and follow-up activity you already collect, so you can see what is happening and what needs attention next.
What Reporting Dashboards Means in Plain Language
A reporting dashboard is a single view that pulls together the lead, pipeline, appointment, marketing, and follow-up activity your business already collects. Instead of opening five tools to understand what is happening, you look at one screen and see what needs attention, with each metric defined in plain language so everyone reads it the same way.
RJ Semaj Solutions builds dashboards from available, connected data. We start from the decisions you need to make, verify each data source, test the calculations, and document the limitations. We do not guarantee revenue, leads, rankings, or any business result, and a dashboard cannot make decisions for you. It gives you a clearer picture to make your own.
Who This Is a Good Fit For
Reporting dashboards are a good fit for businesses that collect activity in several areas but struggle to see what is happening or which follow-up and marketing activities need attention.
- A business with activity spread across several disconnected tools
- A business that gathers numbers but is not sure what to do with them
- A business whose reports use vague or inconsistent definitions
- A business that wants one clear picture instead of five tabs
- A business that wants to spot what needs attention before it slips
Who May Not Need It Yet
A dashboard is not always the right first step. You may not need it right now if any of these are true.
- Your activity lives in one tool and a simple report is enough
- You have not yet connected the data the dashboard would rely on
- You want a guarantee of revenue or results, which we do not provide
- You need legal, compliance, or financial analysis, which a dashboard cannot replace
Common Needs We Help With
These are the everyday reporting problems small businesses bring to us. We address them with connected data and plain-language definitions, not fear or exaggerated promises.
Scattered numbers
Activity is spread across several tools, so no one has a single picture of what is happening.
Unclear definitions
Two people read the same number differently, so reports cause confusion instead of clarity.
Vanity metrics
Reports show numbers that look impressive but do not help anyone decide what to do next.
Missing data connections
Useful activity is collected but never connected, so it cannot be seen in one place.
Inconsistent reporting periods
Reports cover different time frames each time, so it is hard to compare one period to the next.
Reports that do not lead to action
Numbers are gathered but no one knows what to do with them, so the effort does not change anything.
The RJ Semaj Solutions Approach
We confirm the decisions the dashboard should support, define each metric, verify the data sources, configure the dashboard, test the calculations and permissions, document the limitations, and establish a review routine. We explain technology in plain language, recommend only the tools that fit your needs, separate each client's information, include human-review points, and test systems before launch.
AI may support drafting and production, but it does not replace professional review or your approval. Every metric is defined and tested with you, and the dashboard launches only after you approve it.
From Metric to Decision
A number is only useful if it helps you decide something. This table shows example indicators and the decisions each one can help a business make. These are illustrative examples, not real results, and the exact metrics are defined in your proposal.
| Example Indicator | What It Shows | What It Can Help You Decide |
|---|---|---|
| New leads by source | Where your recent inquiries are coming from. | Which sources are worth attention and which may need a different approach. |
| Pipeline by stage | How many opportunities sit in each stage of your sales process. | Which stage has a backlog and where opportunities may be stalling. |
| Appointments booked | How many meetings or consultations were scheduled in a period. | Whether booking activity is keeping up with your pipeline and goals. |
| Follow-up response time | How quickly new inquiries receive a first response. | Whether follow-up is fast enough or needs a different workflow. |
| Marketing activity | How consistently content, posts, or campaigns are going out. | Whether your presence is staying consistent or going quiet. |
| Review requests sent | How often you are asking customers for reviews. | Whether review requests are happening at the right moments. |
What it shows: Where your recent inquiries are coming from.
What it can help you decide: Which sources are worth attention and which may need a different approach.
What it shows: How many opportunities sit in each stage of your sales process.
What it can help you decide: Which stage has a backlog and where opportunities may be stalling.
What it shows: How many meetings or consultations were scheduled in a period.
What it can help you decide: Whether booking activity is keeping up with your pipeline and goals.
What it shows: How quickly new inquiries receive a first response.
What it can help you decide: Whether follow-up is fast enough or needs a different workflow.
What it shows: How consistently content, posts, or campaigns are going out.
What it can help you decide: Whether your presence is staying consistent or going quiet.
What it shows: How often you are asking customers for reviews.
What it can help you decide: Whether review requests are happening at the right moments.
No fabricated results, counts, or percentages are shown. The dashboard is built around your agreed metrics, not this example.
What a Connected Dashboard Gives You
These are operational and customer-experience benefits. We do not promise revenue, leads, conversions, rankings, or any business result.
One clear picture
Agreed lead, pipeline, appointment, marketing, and follow-up activity come together in one view instead of scattered across tools.
Plain-language metrics
Each metric is defined so everyone reads the same number the same way, with no vague labels.
Verified data sources
We confirm where each number comes from and that the connection is reliable before it appears on the dashboard.
Tested and documented
Calculations are tested and limitations are written down, so the numbers are trusted and understood.
Right people, right views
Permissions are configured so each person sees what they need, following the access rules you approve.
A routine, not a one-off
A simple review routine keeps the dashboard useful and is updated as your priorities change.
How a Reporting Dashboard Unfolds
Six steps from confirming the decisions to establishing a review routine. The exact timeline depends on your scope, access, and how quickly approvals move, and is shared in your proposal before work begins.
- 1
Confirm the Decisions the Dashboard Should Support
We start with the decisions you actually need to make, so the dashboard shows what matters instead of every available number.
- 2
Define Each Metric in Plain Language
We define each metric so everyone reads the same number the same way, with no vague labels or vanity figures.
- 3
Verify the Data Sources
We confirm where each number comes from and that the connection is available and reliable before it appears on the dashboard.
- 4
Configure the Dashboard
We build the dashboard around the agreed metrics, with permissions set so the right people see the right views.
- 5
Test Calculations and Document Limitations
We test the calculations and write down the limitations, so the numbers are trusted and understood rather than mysterious.
- 6
Establish a Review Routine
We set a simple review routine so the dashboard stays useful and is updated as your priorities change, with scope defined in your agreement.
Possible Dashboard Scopes
These describe common scopes so you can think about what fits. Prices, inclusions, and revision limits are defined in your written proposal after we understand your needs. We do not publish prices here, and no revenue or result is guaranteed.
Starter operations dashboard
A practical dashboard covering a few agreed operational indicators, so you can see the basics in one place. Suited to a business that needs a clear starting picture before adding more.
Lead and sales dashboard
A dashboard focused on lead sources, pipeline stages, appointments, and follow-up activity, so you can see what needs attention in your sales process. Suited to a business that wants to understand and act on its pipeline.
Recurring reporting support
After launch, the dashboard is reviewed and updated as priorities change, with changes covered by the support terms in your agreement. Suited to a business that wants reporting to keep pace with its activity.
What We Ask of You
A useful dashboard depends on a few things from your side.
- Telling us the decisions the dashboard should support, so it shows what matters
- Confirming the metrics that matter to your business and how you define them
- Granting access to your connected data sources only when needed and as agreed in your proposal
- Approving who on your team can see which views
- Maintaining the accuracy of the connected data sources the dashboard relies on
- Reviewing and approving the dashboard before it launches
Honest Limitations
Clear terms are part of every project. Here is what we do not promise.
- We do not guarantee revenue, leads, conversions, rankings, or any business result
- The dashboard shows what connected data reports; it depends on the accuracy and completeness of its sources
- We do not guarantee that every figure is complete or error-free
- Whether an external platform can be included depends on whether a reliable connection is available for it
- We do not provide legal, compliance, or financial advice based on the dashboard; consult a qualified professional for those requirements
- Project timelines depend on your scope, access, and how quickly approvals move
- Platform and usage charges from third-party tools are separate from our service fee and are disclosed in your proposal
Related Services and Logical Next Steps
A dashboard is most useful when the activity behind it is organized and consistent. These services pair naturally with reporting dashboards.
Sales Pipeline Setup
A dashboard is only as useful as the pipeline behind it. Set up clear stages first so the numbers mean something.
Social Media Management
Connect consistent marketing activity to your dashboard so you can see whether your presence is staying on track.
Reputation and Review Management
Track review requests and responses alongside your other activity so reputation stays visible, not forgotten.
Reporting Dashboard Questions
Practical answers about available metrics, data accuracy, external platforms, update frequency, permissions, custom reports, interpretation, and limitations.
See Your Activity Clearly in One Place
Schedule a free business growth assessment. We will review the activity you already collect and what a practical dashboard could show for your business. No obligation.
Mon - Fri: 8:00 AM - 1:00 PM CT · Appointments outside these hours may be available by request.